

Strava’s 2018 Fascinating Year In Review Stats makes for interesting reading.


The easiest gender stat to understand is that Strava is pretty male place. In one year there were 149 million total uploads by women and 636 million uploads by men. That means that 77% percent of the activity uploads were by men and just 23% by women.
According to the report, “the differences in speed, or duration aren’t actually that much different between men and women. Only 5-8 minutes shorter for rides, and slightly slower for runs.”
My fave stat in the report concerns preferred beverages. Cyclists drink more coffee and runners drink more beer. But everyone likes cake! Cake comes in third–just behind beer and coffee–as the food or beverage athletes prefer. I was thinking that ice cream would be up there. But that might be just me.
In order, runners prefer beer, coffee, cake, cookie, donut, pastry.
Cyclists like best coffee, beer, cake, cookie, donut, pastry.
No bananas. No bagels!
Where’s the data come from? It’s not as Strava connected devices track beer and donuts after all. Instead, these numbers are all self-reported. But all self-reported in a particular way. Strava got the numbers from the titles of individual workouts. (If you don’t give your workout a title, it gets the default of time of day + activity. Morning run or afternoon ride, for example.
So really it means that runners are more likely than cyclists to put the word “beer” in the title of their workout. Ditto cyclists and “coffee.” Given how many “morning coffee rides” I’ve been on that’s no surprise. There might also be a gendered element. There are a lot of women running, and lots of them not on Strava. I suspect women runners would be less likely to give their run a beer-themed name. But I’m just speculating.

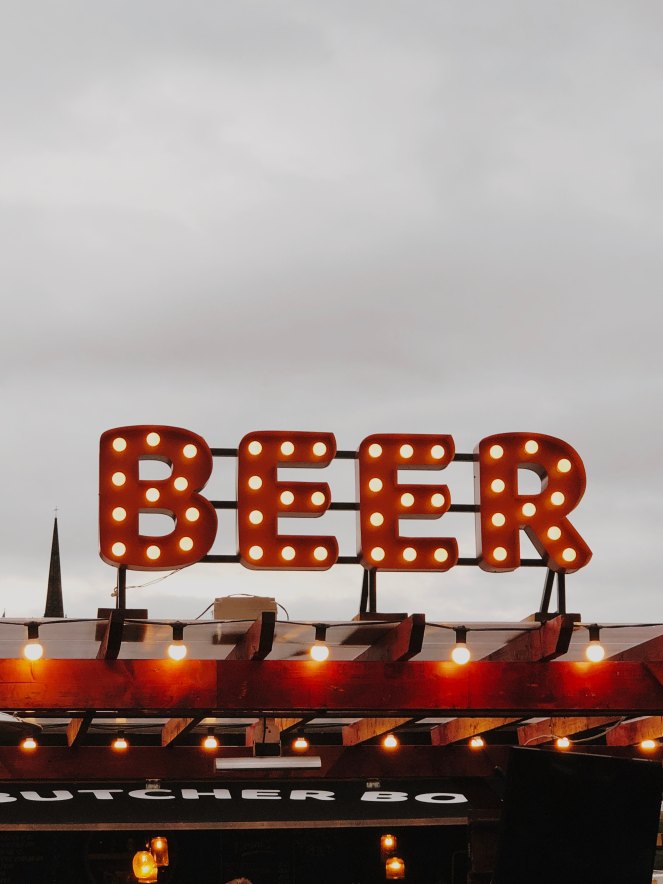
Photo by Jon Tyson on Unsplash